QtiPlot
vasilief


Source (link to git-repo or to original if based on someone elses unmodified work):
2011/11/02 - QtiPlot 0.9.8.9 released:
Improvements:
*Improved support for the Dock menu on Mac OS X.
*Improved restoring of statistic tables.
*Improved handling of error messages in Savitzky-Golay smoothing filter.
*Improved plotting of 2D plot layers with shared axes.
*Improved error bar handling when plotting a table column selection.
*Implemented feature request #5451: "Do not expand tree in Project Explorer".
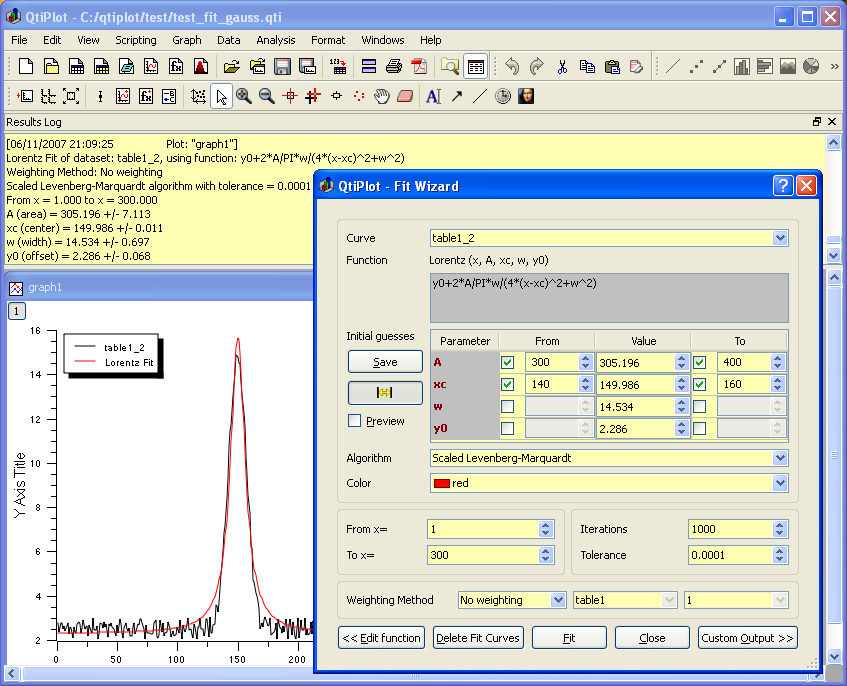
*Implemented feature request #5458: "Fit wizard remove only fits from session".
*Updated translations: Italian (thanks to Renato Rivoira), German (thanks to Daniel Schury) and Romanian.
*Updated Italian manual thanks to Renato Rivoira.
Bug fixes:
*Fixed crash when opening old projects containing spectrograms.
*Fixed duplication of 2D plots with respect to the synchronization of scales.
*Fixed speed issues in matrices and removed size limitations in matrix size dialog.
*Fixed export of minus sign to LaTeX.
*Fixed possible crash when resetting the default options via the preferences dialog.


Other Science:


Ratings & Comments
347 Comments
I tried to pack the source code and I got the error that qtiplot-0.9.8.5/manual/manual.pro file is missing. Can you please take a look.
Can i manipulate it from a python script? like sending data and modeling the plot whitout using qtiplot -x something.py?
If you download the linux binary, this program works okay. However, if you wish to compile this program on your machine, be prepared for a wild ride. I have compiled numerous programs, but I have been unable to compile this one. I have all of the recommended software and the latest source continued to prompt me for emf.h and wine header files. Finally I copied all of the wine header files into the EmfEngine src directory, only to have the compiler fail during the 2D graph, but without any error message. I do not believe that the author has a full list of the compilation dependencies.
Hi, I am trying to install the last version of qtiplot 0.9.7.7 . I downloaded all the necessary libraries from the official site. I succeed to make Qtiplot search for the files in the right location but still have an error message when trying to compile it. In file included from src/table/Table.h:41, from src/plot3D/Graph3D.h:40, from src/plot3D/Graph3D.cpp:29: src/scripting/Script.h:67: attention : qualificateurs de type ignorés pour le type à retourner par la fonction src/plot3D/Graph3D.cpp: In member function ‘void Graph3D::setNumbersFont(const QFont&)’: src/plot3D/Graph3D.cpp:780: erreur: ‘class Qwt3D::ColorLegend’ has no member named ‘axis’ src/plot3D/Graph3D.cpp: In member function ‘void Graph3D::setNumbersColor(const QColor&)’: src/plot3D/Graph3D.cpp:1647: erreur: ‘class Qwt3D::ColorLegend’ has no member named ‘axis’ src/plot3D/Graph3D.cpp: In member function ‘void Graph3D::scaleFonts(double)’: src/plot3D/Graph3D.cpp:1685: erreur: ‘class Qwt3D::ColorLegend’ has no member named ‘axis’ But I don't understand where is the problem. I checked the file qwt_color_legend.cpp and in the class ColorLegend there is a variable called axis! ColorLegend::ColorLegend() { axis_.setNumbers(true); axis_.setScaling(true); axis_.setNumberColor(RGBA(0,0,0,1)); axis_.setNumberAnchor(CenterRight); axis_.setNumberFont(QFont("Courier",8)); caption_.setFont("Courier", 10, QFont::Bold); caption_.setColor(RGBA(0,0,0,1)); axisposition_ = ColorLegend::Left; orientation_ = ColorLegend::BottomTop; showaxis_ = true; setRelPosition(Tuple(0.94, 1-0.36),Tuple(0.97, 1-0.04)); } Help?
Hi Ion, I have successfully compiled and installed the qtiplot9.7.7. It works well but the "undo" function seems not working. Is there something wrong with my compiling?
Now all right!
I can't download (Source). prdownload.berlios.de not accessible.
Hi I got the following error compiling qtiplot. Anyone can explain how I can fix this? ld: symbol(s) not found collect2: ld returned 1 exit status make: *** [qtiplot.app/Contents/MacOS/qtiplot] Error 1 Thanks in advance..
Hi I got the following error during qtiplot compiling. Can anyone help me out? ../3rdparty/liborigin/OriginObj.h:37:29: error: boost/variant.hpp: No such file or directory ../3rdparty/liborigin/OriginObj.h:38:48: error: boost/date_time/posix_time/ptime.hpp: No such file or directory where I can get this missing file? thanks in advance..
They are both corrupted.
What do you mean by corrupted? I can build QtiPlot 0.9.5 without problems using the source archives.
Tar or unzip produce errors, tar yields incomplete sources. I downloaded twice from Berlios. Could retry.
There's something completely wrong on your system!
OK. Got good archives. As in past versions, I never succeded in compiling the "3rdParty" stuff. Some suggestions: 1. A configure script that can set paths of existing installed packages suchs as gsl. 2. More sophisticated: Kde had that konstruct package that downloaded as well as built compnonents. Such would get qwtplot, etc. and build them first in the folders you want. 3. I could install a .deb but have no need for a service contract. Using "checkinstall", any one who succedes in compiling everything could create a .deb (even though these usually are not canonical Debian ruled installations) so why not simply give us a good .deb (with no customer support--want that, pay for it!).
You can download the compiled binaries for Linux for free, you don't need a .deb to use QtiPlot. If you want the .deb package that I maintain, you need to subscript for a maintenance contract.
Is it possible to remove the scrollbars when the window reaches the edges of the working area? It's very disturbing.
Hi, long to since me testing this software. I am using Fedora 8 and I get this error when compiling: I located my docbookx.dtd and edited manual/docbook-en/index.docbook appropriately but got this new error: How to fix this?
I get the same on my Fedora 8...:(
this is not an open source project. you have to pay for it. so plz remove it.
You can download sources from http://soft.proindependent.com/download.html Compile by yourself and have a fun.
Hello I really appreciate the work that led to such a great program. I think that Qtiplot is the only candidate to be a serious plotting program for linux. However, a found some problems. 1) Recently, I compiled 0.9 ver and found the bug regarding the subscripts. After putting subscripts into plot legend or text within plot area, it is displayed in new line as a normal text. 2) Exported plots to EPS format posses completely rescaled fonts and all proportions are not conserved. This makes such plots useless. I also have a suggestion to implement something like a New Page to qtiplot. Such page should have a ruler in metric scale that would makes arrangement of the plot much easier (as in RLPlot program, for example). Now, I am trying to prepare figures for a scientific publication and so much pain must be taken to make all plots the same size and look. Is it possible to obtain description of the qti file format? I would like to add an option to export data in my program (www.eleana.xt.pl) that could be immediately loaded into qtiplot. Anyway, the program is really great!!! Congratulation.
Hello, And thanks for the nice words about QtiPlot. Concerning the 'BUT' part: 1) You must use the last Qwt 5.0.2 version as indicated on the QtiPlot webpage. With this version I can't reproduce the bug! 2) Open the export dialog, click the "Advanced" button and check the option: "Keep aspect ratio" Concerning your suggestion: this could be helpful indeed. Please add a feature request on the berliOS tracker at: https://developer.berlios.de/feature/?group_id=6626 so that I don't forget about it! There's no official description of the .qti file format. Just look at the sources! Anyways the file format will probably changed to a full XML format in the future... Exporting your data as columns of ASCII, separated by commas, tab or whatever, would be OK! Hope this helps and best regards, Ion
Congratulations for this new release. Qt4 port must be a huge effort, but Qtiplot looks now amazing. Now I can use my Origin files in linux. Thanks again.
Hello, Thanks for your nice words! Yes, it's true, in order to release the 0.9 version, I had to work very hard, during many hours! Regarding the import of Origin projects, it's essentially Alex Kargovsky's work! I only helped a little bit on this... Best regards, Ion
Hi I use a col text for to index a reference. This col is none type and it has text display properties. Well I write the reference with numbers within brakets (for example [1]). Well I write 5 references without problems but when I write the sixth reference ([6]) qtiplot show a error msn. "Qtiplot- Script Error", Undefined token "[6] " found at position 0. at :0 " What happend? Thanks for all Note: Zorry for to posting rather msgs but I use a lot qtiplot, I need it and I like it.