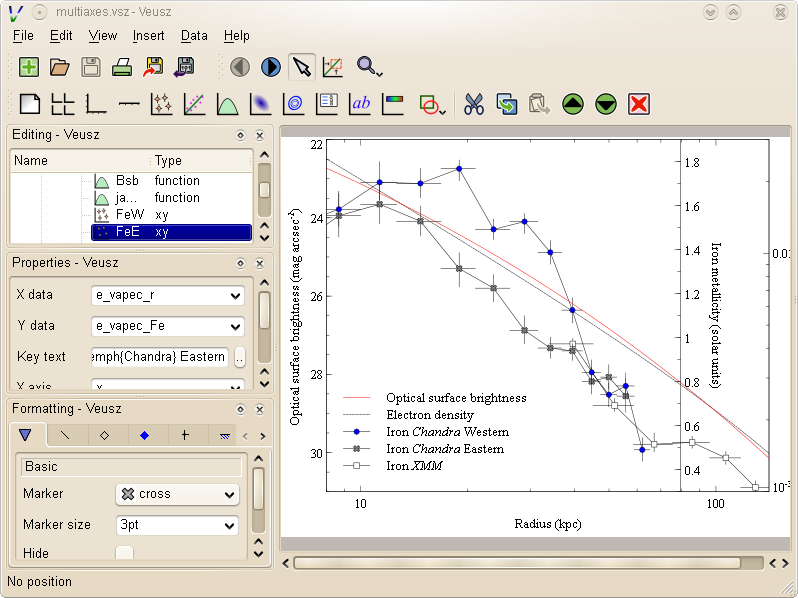
Julius Model Viewer
juergenmueller


Homepage
Source (link to git-repo or to original if based on someone elses unmodified work):
Changes in 3.1:
Improvements:
* Do not print or export hidden pages
* Allow expressions in dataset of contour widget
* Allow widgets to be excluded in key (thanks to Alexander Book)
* Make bezier line better fit data
* Switch linux binary from x86 -> x86-64 for better compatibility
Bug fixes:
* Compilation fix for PyQt>=5.12 (thanks to Dimitry Shachnev)
* Ensure fit settings are sorted in output file
* Fix crash in contour labelling
* Fix 3D axis crash bug
* Fix problem with broken axis with null-sized regions
* Fix issue with 0-sized images in image widget
* Fix function widget crash with certain plotting range
* Fix for axis crash with large magnitude ranges
* Fix CSV importing issues for 2D and ND data
* Fix zero division error in 2D import
* Fix crash on importing HDF5 files with variable length text
* Catch issue with zero range axes
* Fix crash is using set in dataset expression
* Fix crash when moving line coordinates
* Remove deprecation warnings when compiling with recent Qt versions
Changes in 3.0.1:
* Change in build system to use qmake to find Qt locations. This is to fix
the build inside Anaconda. Also Qt and sip parameters can now be given
as environment variables.
* Fix problem when picking points with too many non-finite values
* Change default SVG export DPI to 96 to match inkscape and provide
option in dialog to choose export DPI
* Allow %PAGE% and %PAGENAME% in export filename for single page output
* Fix failing fitting due to iminuit differences
* Fix crash if both ends of part of broken axis widget are the same for
EMF exporting
* Update to Qt 5.11.1 and update PyQt and sip in Windows binary
* Build Mac and Linux binaries with EMF export
Changes in 3.0:
* New 3D support for plotting points, functions, surfaces and volumes
* Add --export-option parameter for command line exporting control
* Add templates in preferences for exported file names, add %PAGE00% and
%PAGE000% options for zero-prefixed page numbers, and change %PAGENUM%
to %PAGE%
* In export dialog allow user to specify arbitrary pages to export
* Change miter limit for lines, which fixes some problems when exporting
arrow to PDFs
* Use flat cap on lines with arrows, to avoid line showing through head
* Support datetime64 and string/unicode characters in npy/npz import
* Add \hat LaTeX support


Other Science:


Ratings & Comments
25 Comments
I am using scientific linux 6.2. I am a beginner at linux platform. I tried to install veusz but could not be able to do it. Kindly guide me to do the same asap. I need it urgently for my paper work.
You could try the linux binary here: https://veusz.github.io/download/ (just updated today). It requires a x86-64 system. Unpack and try running veusz.exe.
downloaded veusz-3.1-linux-x86_64.tar.xz from the site you mentioned, unpacked it, tried running veusz.exe but it did not run even with wine also. my OS scientific linux 6.2 acceps RHEL 7 things generally. plz help.
Even though it's .exe, it's linux, not windows. I can't diagnose the problem without more information. I suggest filing an issue here https://github.com/veusz/veusz/issues or using the veusz subreddit on reddit. Please supply any error messages.
thank you very much. veusz.exe is now running on my laptop. I am able to do my work on veusz now.
This app is great. The quality results are gorgeous and ready for professional journal. I've tried other programs and Veus is better.
Gibbs triangle would be very nice ;) I need it cause I am studying chemistry
I have a couple of patches too submit. Where should I send them?
Just send them to the mailing list veusz-discuss, https://mail.gna.org/listinfo/veusz-discuss
Hi, I really like your app. The usability for me is much better than with other commercial competitors. Thank you! However, I do have some trouble, when I try to plot data with >100000 data points (no you cannot compress that). Then the performanc is quite slow. I think this is due to the usage of python as a interpreter language, right? Or can I improve something else on my machine? Thanks again!
You can turn off antialiasing by right clicking on the plot and deselecting it. This helps speed up things a lot!
Veusz 1.8+ is much faster for plotting large datasets as the inner plotting loops have been rewritten in C++.
Seems a great apps. But, there already exist a similar application : Kst. Why have you prefered to make a new application instead of improve Kst?
At the time when I started Veusz kst seemed more to be more of a realtime plotting application. I haven't looked at kst recently. The focus on Veusz is to make nice plots to put in publications with a lot of flexibility on how they look. Also writing in Python is so much more enjoyable than waiting for C++ to compile, as I know from experience.
I saw your post in the SciPy mailing list. As you may know there's no 'main' plotting package for Python, there's still a bunch of different packages all with their pros and cons. But now momentum goes to matplotlib also because of his matlab-style commands
I suggest you to focus on the command-line interface, the GUI is good but useless for most programmers (please don't take it badly ;) ). I'm a qt fan and this is my favourite in the next "Python-SciPy plotting wars".
Go on with you work. Congratulations!
do you plan to release a debian package?
I don't have access to a Debian system, so not currently. I'd be happy to work with someone who knows Debian to get it working.
Debian packages (for stable testing and unstable): http://repos.knio.it ;) Have a Nice Day ;)
Debian packages (for stable testing and unstable): http://repos.knio.it ;) Have a Nice Day ;)
I tried to access this site and got the following message: Unable to determine IP address from host name for repos.knio.it Name Error: The domain name does not exist.
Unfortunately that repo looks dead. There's a Debian bug here about the packaging: http://bugs.debian.org/cgi-bin/bugreport.cgi?bug=447524 It's annoying as we already have the program packaged but there's no debian sponsor. There are recent Ubuntu packages here: https://launchpad.net/~brywilharris/+archive/ppa
It's a great app! I was looking for something like it for a long time. Thanks!
This looks very nice. Is there a way to skip a column when constructing the Descriptor string? e.g., I have a data file in which the first column is an ID string, and can't be parsed as a float...
Useful idea. I've just put some code into CVS to fix this problem. Now Veusz reports the number of errors reading a variable, rather than throwing an exception. This means you can use a dummy variable to ignore a string column. In the future I plan to support reading strings (for bar graphs), but it's further down my priority list. The fix will be in the next release, but feel free to download via CVS (it's fairly easy). See https://gna.org/cvs/?group=veusz I've had to change the scripting interface to the ImportFile and ImportString commands to return the error count in addition to the variables read.
Please be aware this program requires PyQt and numarray (Python). There isn't a fancy installer yet either (there will be one in the future).