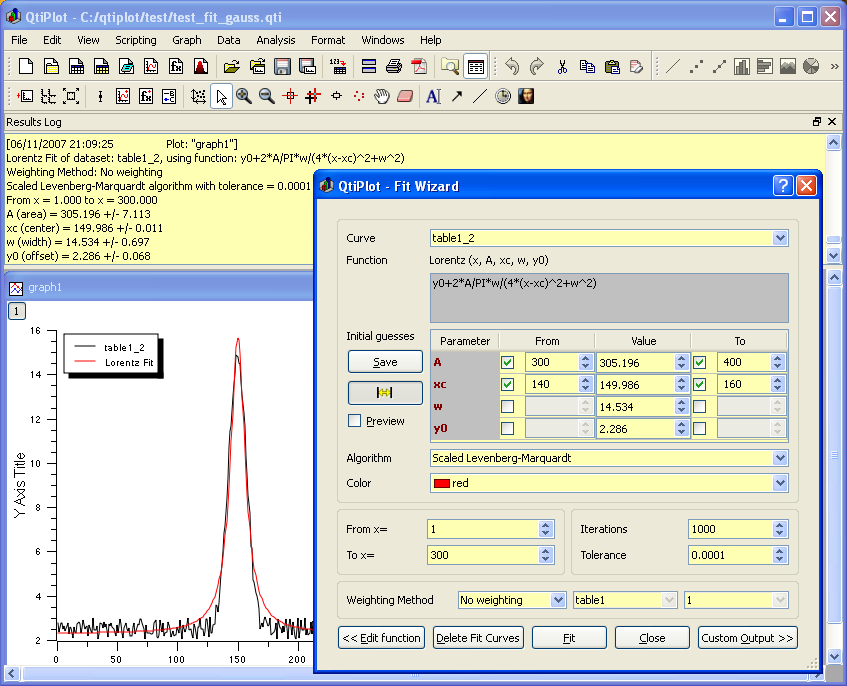
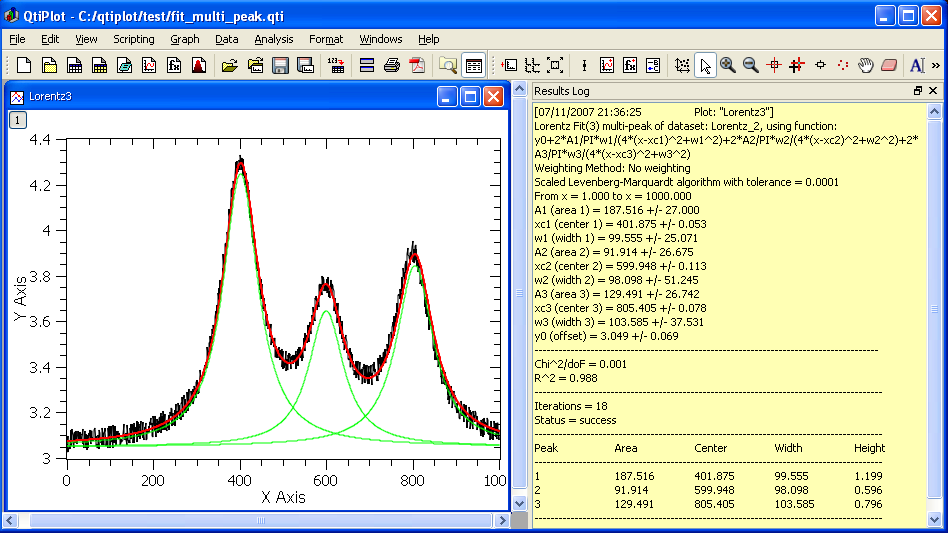
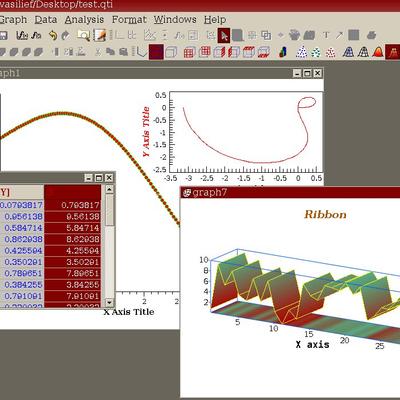
QtiPlot
vasilief


Source (link to git-repo or to original if based on someone elses unmodified work):
2011/11/02 - QtiPlot 0.9.8.9 released:
Improvements:
*Improved support for the Dock menu on Mac OS X.
*Improved restoring of statistic tables.
*Improved handling of error messages in Savitzky-Golay smoothing filter.
*Improved plotting of 2D plot layers with shared axes.
*Improved error bar handling when plotting a table column selection.
*Implemented feature request #5451: "Do not expand tree in Project Explorer".
*Implemented feature request #5458: "Fit wizard remove only fits from session".
*Updated translations: Italian (thanks to Renato Rivoira), German (thanks to Daniel Schury) and Romanian.
*Updated Italian manual thanks to Renato Rivoira.
Bug fixes:
*Fixed crash when opening old projects containing spectrograms.
*Fixed duplication of 2D plots with respect to the synchronization of scales.
*Fixed speed issues in matrices and removed size limitations in matrix size dialog.
*Fixed export of minus sign to LaTeX.
*Fixed possible crash when resetting the default options via the preferences dialog.


Other Science:


Ratings & Comments
10 Comments
* I do not know why the previous comment was repeated.
hi, a can not install qtiplot in my KDE neon User Edition 5.19. I tried using apt but: Package qtiplot is not available, but is referred to by another package. This may mean that the package is missing, has been obsoleted, or is only available from another source. So, please, how can I install qtiplot in my system? Thanks
hi, a can not install qtiplot in my KDE neon User Edition 5.19. I tried using apt but: Package qtiplot is not available, but is referred to by another package. This may mean that the package is missing, has been obsoleted, or is only available from another source. So, please, how can I install qtiplot in my system? Thanks
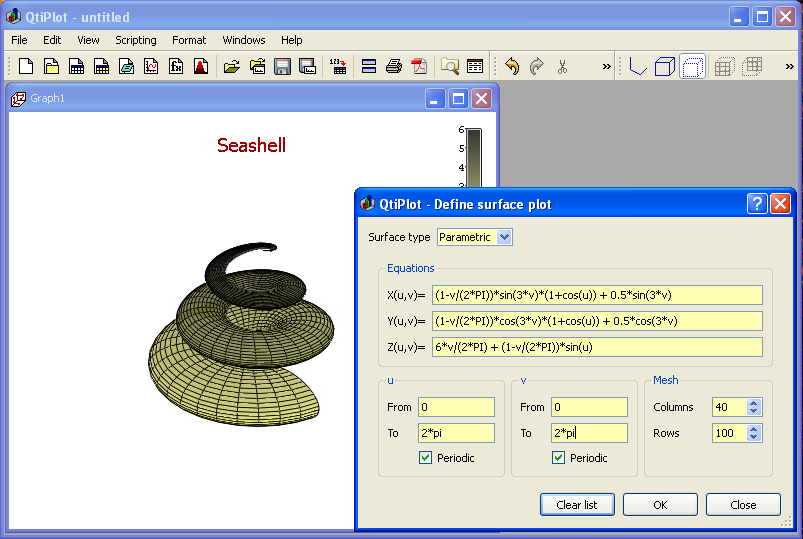
I am a user, and I found this work is great! I want to visualize the 3D data with the surface plot. Anyway, the raw data was stored as a typical 3-column table as following: x(1) y(1) z(1,1) x(1) y(2) z(1,2) x(1) y(3) z(1,3) x(2) y(1) z(2,1) x(2) y(2) z(2,2) x(2) y(3) z(2,3) I know there exists an item as "Convert to Matrix" under the menu "Table". I tried to convert the 3rd column (z) to a matrix - if it works, obviously i will get the 3D graphic option for further plot. Unfortunately, it failed to give a 3x2 matrix but keeps the same form as the table. I am wondering whether there is some method to realize the conversion, or some way to visualize this 3-column data easily? Regards, Tianmin
Hi, The issue is solved in the last release of QtiPlot, 0.9.8.3. Please try it, the conversion should work now. I hope this helps and best regards, Ion Vasilief
After installing the qtiplot (windowsxp) the program is looking for python25.dll and abort the start. This dll is neither in the folder python25 or another folder! how can i get this dll and isnstall it!?
Hello, As indicated on the downloads web page of QtiPlot it was required to install Python 2.5.4 separately. Now I've just added python25.dll to the Windows installers, so just redownloading and reinstalling QtiPlot should fix the issue. I hope this helps and best regards, Ion Vasilief
will it be able to replace gtkwave (i'm interested in tool to display vcd files generated bu ghdl)
It is to 0.9.3-rc2 which no longer is current. Simple change.
Hello, Thanks for the info! I've updated the download link. Regards, Ion