Plasma 6 Version Available Here "https://www.pling.com/p/2160638/"
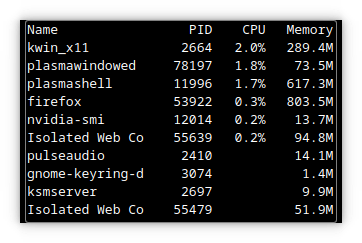
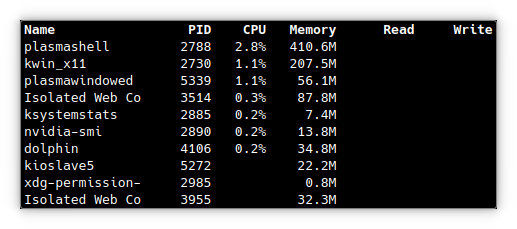
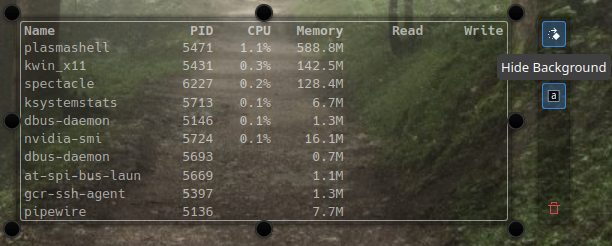
Plasmoid to display a limited number of system processes and resource usage.
Best way I have found to update to new a version is to use kpackagetool5, details below.
Note: The Values displayed by this plasmoid should closely match those reported by plasma-systemmonitor (Application launcher >> system >> System Monitor) one noticeable difference from top, htop, etc is memory usage, this plasmoid reports Proportional Set Size for memory usage, see https://en.wikipedia.org/wiki/Proportional_set_size for details.
## Requirements
Plasma 5 shell (plasma >= 5.7).
## Installation
### Using Discover
Search for "Process Monitor" in Plasma Addons, Plasma Widgets.
### From store.kde.org
1. Go to the desktop. 3. Right Click the desktop, select "Add Widgets". 4. Click "Get New Widgets". 5. Click "Download New Plasma Widgets". 6. Search for "Process Monitor". 7. Click Install. 8. Close Installer Window. 9. You can now add the Widget to the desktop, Right Click desktop and select "Add Widgets", search for "Process Monitor", drag to desktop or Panel.
### Using kpackagetool5
1. Download Package. 2. Open Konsole. 3. Go to download location 4. Enter "kpackagetool5 -i filename". 5. Close Konsole. 6. You can now add the Widget to the desktop, Right Click desktop and select "Add Widgets", search for "Process Monitor", drag to desktop or Panel. 7. To update to latest version. 8. Do steps 1 thru 3. 9. Enter "kpackagetool5 -u filename". 10. Close Konsole 11. logout / login to load new version.
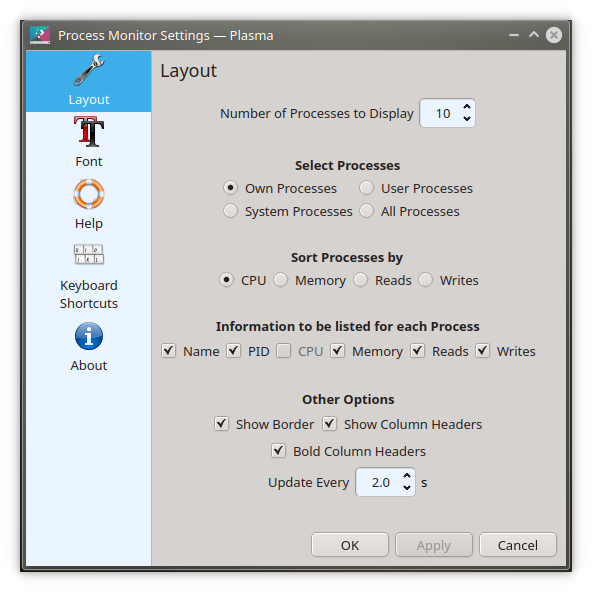
# Configuration
Right Click the Plasmoid and select "Configure Process Monitor.."
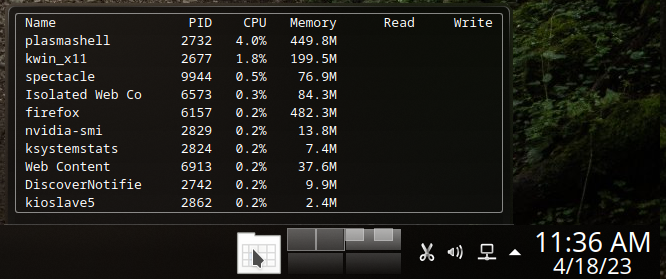
* Change Number of Processes to Display to change the number of rows in the display. * Select the information to sort on, Higher values will be shown at the top of the list. This Information will also be displayed as a column in the list. * Select any additional information to be listed for each Process. * Select Show Border to create a thin border around the list. * Select "Show Column Headers" to display a header above each column. * Select "Bold Header Columns" to show the column headers with a bold font. * When added to a panel or other small space Process Monitor will only show a icon. Left click the icon to show the full display in a popup. * Select how often to update the list in seconds."Last changelog:
Thank you! I've installed it in my testing system with Plasma 6, and works perfectly well, while many other components are still to be ported to Plasma 6 or have some bugs to be fixed before I can move from Plasma 5 to 6 completely.
I wanted bstrong5280 to know, that there is nothing wrong with his widget, as far as I can tell, and also, no compatibility issue with Debian. The reason I had reported a bug before was the apparent fact, that programs such as 'htop' and 'KSysGuard' report a different, larger amount of physical memory used, from the quantity which his widget shows. Thus, if one were to extend the list of the widget, one would also find that process which I thought was somehow missing. For my purposes, I don't need to know which of the two quantities is more correct. I just need to be able to spot processes quickly, that seem to have gotten huge. :)
8This monitor fills a gap for me, of what was missing, so that I am now able to get a good, fast view of whichever processes might suddenly be taking up a lot of RAM. However, there is one problem with it. It will often just skip certain processes, when told to sort them according to memory usage. For example, baloo_file is sometimes there after a reboot, and sometimes just not, until the next reboot.
I don't normally have baloo enabled, but enabled it to see what is happening. According to the system logs the baloo indexer is crashing due to bad memory allocations.
I know that some people have problems with baloo, but I do not. So, even on the laptop where Process Monitor fails to list baloo, baloo continues to work well. But, whether this could be why your widget fails to list it, is another question I do not know the answer to. There could be bad allocations, but 'top' still lists mine as running.
When I was testing baloo it would be listed in Process Monitor until it crashed. This This plasmoid gets its information from the same place as Process Monitor. If baloo is not show in Process Monitor it will not be show in this plasmoid either. Odd that is listed in top but not Process Monitor. Not sure where to go from here.....
You created a problem when you named your plasmoid "Process Monitor", but then insisted that the Process Monitor is something else. What else is the Process Monitor? What I can tell you is, that on my computer, in addition to 'top', 'KSysGuard' lists baloo, but not your plasmoid. When you call something the Process Monitor, is it KSysGuard you are referring to? Also, why does baloo finally not work on your computer, but work on mine?
Sorry missed typed should have been. "When I was testing baloo it would be listed in System Monitor until it crashed. This plasmoid gets its information from the same place as System Monitor. If baloo is not show in System Monitor it will not be show in this plasmoid either. Odd that is listed in top but not System Monitor. Not sure where to go from here....."
I think I understand the problem now. What I would expect a Plasmoid to do is, to use programs that are native to Linux, in order to display their information in a different way. But instead, you used an out-of-tree tool available from GitHub, which has the same name as your widget. Thus, your widget will display the same errors that this tool would display. Obviously, I'm not about to install Process Monitor, now that I've learned it gives false results... https://github.com/Sysinternals/ProcMon-for-Linux
We are obviously referring to a different plasmoid, cause I can't see that reference in the qml, nor in the C -Library.
All that we know is that there is a bug, and bstrong5280 should be the man to easily find and solve it.
Well actually, we're referring to the same Plasmoid. But, bstrong5280 keeps writing that his or her Plasmoid gives them the same output as "Process Monitor". Since that is also the name of the Plasmoid, I've asked this person several times to explain what 'the other Process Monitor' is. And so far, bstrong5280 has given no answer. Their only answer seems to be, that 'Process Monitor' lists the same results as "Process Monitor". He or she assumes no other responsibility.
I corrected by earlier comment. My plasmoid is "Process Monitor", the other process I was referring to is "System Moniitor". My plasmoid only uses programs native to linux.
In that case I apologize, for the fact that I did not catch on to your correction quickly enough. I'm based on Debian 11. The closest match which I can find for Debian, is 'gnome-system-monitor'. The same command exists, if that package is installed. But, if all your Plasmoid does is, report information exactly as "Gnome System Monitor" reports it, how do you intend to correct any errors?
Also, when one looks at the screen footage at GitHub, they seem to recommend running their Process Monitor program with 'sudo' or root. Obviously, when your Plasmoid displays, it will do so with regular, user privileges, which could be another reason why the information is incomplete.
What you might find is, that you cannot simply enable Baloo, but that you must specify significant directories for it explicitly Not to index. If you fail to do that, you may find that on any typical PC, there are just too many files for it to index, and then you may OOM. But, this is also why it would be useful for me, to keep an eye on the process 'baloo_file', and what its memory consumption is at any moment.
I was able to get baloo to stay running. For me it always shows up in Process Monitor and System Monitor. To see it in Process Monitor I had to increase the "Number of Processes to Display" to 20.
I have already increased the number of processes for your Plasmoid to display to 16. According to my Laptop, 'baloo_file' is taking up 45.6MB of physical memory. That means that on my Laptop, it should be showing between processes 9 and 10 as listed from the top, by your Plasmoid. However, your Plasmoid does not list it at all.
I have a similar issue with Process Monitor. It does list the VirtualBoxVM process and it's cpu utilization, but no memory information. Without further knowledge I suspect a rights issue in the data retrieval. There's definitely a bug, because other apps (even mine) display the memory of VirtualBoxVM.
Of course, I'm no expert on how the Plasmoid works with VirtualBoxVM. It could be some sort of permissions issue as you wrote. But another possibility exists, that the Plasmoid just cannot work properly, if the process has a huge allocation of virtual memory. What Baloo does, is request an allocation of 256GB of Virtual Mem. This could be considered 'normal' on a Linux systems, where the kernel routinely allocates Virtual Mem beyond the Physical Mem available. But it could be tripping up the Process Monitor Plasmoid.


Ratings & Comments
35 Comments
This will be ported to Plasma 6 in the near future.
Any plans to port this great widget to Plasma 6 yet?
Available now. https://store.kde.org/p/2153021/
Thank you! I've installed it in my testing system with Plasma 6, and works perfectly well, while many other components are still to be ported to Plasma 6 or have some bugs to be fixed before I can move from Plasma 5 to 6 completely.
10 Very nice : useful, customizable and simple !
I wanted bstrong5280 to know, that there is nothing wrong with his widget, as far as I can tell, and also, no compatibility issue with Debian. The reason I had reported a bug before was the apparent fact, that programs such as 'htop' and 'KSysGuard' report a different, larger amount of physical memory used, from the quantity which his widget shows. Thus, if one were to extend the list of the widget, one would also find that process which I thought was somehow missing. For my purposes, I don't need to know which of the two quantities is more correct. I just need to be able to spot processes quickly, that seem to have gotten huge. :)
I Added a note about Memory usage to the Product description that may clarify this.
8 This monitor fills a gap for me, of what was missing, so that I am now able to get a good, fast view of whichever processes might suddenly be taking up a lot of RAM. However, there is one problem with it. It will often just skip certain processes, when told to sort them according to memory usage. For example, baloo_file is sometimes there after a reboot, and sometimes just not, until the next reboot.
I don't normally have baloo enabled, but enabled it to see what is happening. According to the system logs the baloo indexer is crashing due to bad memory allocations.
I know that some people have problems with baloo, but I do not. So, even on the laptop where Process Monitor fails to list baloo, baloo continues to work well. But, whether this could be why your widget fails to list it, is another question I do not know the answer to. There could be bad allocations, but 'top' still lists mine as running.
When I was testing baloo it would be listed in Process Monitor until it crashed. This This plasmoid gets its information from the same place as Process Monitor. If baloo is not show in Process Monitor it will not be show in this plasmoid either. Odd that is listed in top but not Process Monitor. Not sure where to go from here.....
You created a problem when you named your plasmoid "Process Monitor", but then insisted that the Process Monitor is something else. What else is the Process Monitor? What I can tell you is, that on my computer, in addition to 'top', 'KSysGuard' lists baloo, but not your plasmoid. When you call something the Process Monitor, is it KSysGuard you are referring to? Also, why does baloo finally not work on your computer, but work on mine?
Sorry missed typed should have been. "When I was testing baloo it would be listed in System Monitor until it crashed. This plasmoid gets its information from the same place as System Monitor. If baloo is not show in System Monitor it will not be show in this plasmoid either. Odd that is listed in top but not System Monitor. Not sure where to go from here....."
I think I understand the problem now. What I would expect a Plasmoid to do is, to use programs that are native to Linux, in order to display their information in a different way. But instead, you used an out-of-tree tool available from GitHub, which has the same name as your widget. Thus, your widget will display the same errors that this tool would display. Obviously, I'm not about to install Process Monitor, now that I've learned it gives false results... https://github.com/Sysinternals/ProcMon-for-Linux
We are obviously referring to a different plasmoid, cause I can't see that reference in the qml, nor in the C -Library. All that we know is that there is a bug, and bstrong5280 should be the man to easily find and solve it.
Well actually, we're referring to the same Plasmoid. But, bstrong5280 keeps writing that his or her Plasmoid gives them the same output as "Process Monitor". Since that is also the name of the Plasmoid, I've asked this person several times to explain what 'the other Process Monitor' is. And so far, bstrong5280 has given no answer. Their only answer seems to be, that 'Process Monitor' lists the same results as "Process Monitor". He or she assumes no other responsibility.
I corrected by earlier comment. My plasmoid is "Process Monitor", the other process I was referring to is "System Moniitor". My plasmoid only uses programs native to linux.
In that case I apologize, for the fact that I did not catch on to your correction quickly enough. I'm based on Debian 11. The closest match which I can find for Debian, is 'gnome-system-monitor'. The same command exists, if that package is installed. But, if all your Plasmoid does is, report information exactly as "Gnome System Monitor" reports it, how do you intend to correct any errors?
Also, when one looks at the screen footage at GitHub, they seem to recommend running their Process Monitor program with 'sudo' or root. Obviously, when your Plasmoid displays, it will do so with regular, user privileges, which could be another reason why the information is incomplete.
What you might find is, that you cannot simply enable Baloo, but that you must specify significant directories for it explicitly Not to index. If you fail to do that, you may find that on any typical PC, there are just too many files for it to index, and then you may OOM. But, this is also why it would be useful for me, to keep an eye on the process 'baloo_file', and what its memory consumption is at any moment.
I was able to get baloo to stay running. For me it always shows up in Process Monitor and System Monitor. To see it in Process Monitor I had to increase the "Number of Processes to Display" to 20.
I have already increased the number of processes for your Plasmoid to display to 16. According to my Laptop, 'baloo_file' is taking up 45.6MB of physical memory. That means that on my Laptop, it should be showing between processes 9 and 10 as listed from the top, by your Plasmoid. However, your Plasmoid does not list it at all.
I have a similar issue with Process Monitor. It does list the VirtualBoxVM process and it's cpu utilization, but no memory information. Without further knowledge I suspect a rights issue in the data retrieval. There's definitely a bug, because other apps (even mine) display the memory of VirtualBoxVM.
This how it is displayed in System Monitor and I use the same data source.
Of course, I'm no expert on how the Plasmoid works with VirtualBoxVM. It could be some sort of permissions issue as you wrote. But another possibility exists, that the Plasmoid just cannot work properly, if the process has a huge allocation of virtual memory. What Baloo does, is request an allocation of 256GB of Virtual Mem. This could be considered 'normal' on a Linux systems, where the kernel routinely allocates Virtual Mem beyond the Physical Mem available. But it could be tripping up the Process Monitor Plasmoid.